The local banks have fallen since May. Is this a good time to enter? Will it do a V shape recovery? I think there is no hurry.
Indulge me while I do a bit of speculation – based on statistics.
STI Aug performance over last 24 years
I have compiled STI data from 1994 to 2017, to check for these 24 years, whether STI closed higher or lower for the month of August.
- 2017 : lower
- 2016 : lower
- 2015 : lower
- 2014 : lower
- 2013 : lower
- 2012 : lower
- 2011 : lower
- 2010 : lower
- 2009 : lower
- 2008 : lower
- 2007 : lower
- 2006 : higher
- 2005 : lower
- 2004 : higher
- 2003 : higher
- 2002 : lower
- 2001 : lower
- 2000 : higher
- 1999 : lower
- 1998 : lower
- 1997 : lower
- 1996 : higher
- 1995 : lower
- 1994 : higher
Out of 24 years, STI closed higher only 6 times out of 24. And these higher closes were more than 10 years ago. STI has closed lower in the month of Aug for the last 11 years!
Contrarians will say that its time the results balance itself out. Note also that past performance is not an indicator of future performance.
Current Market using charts
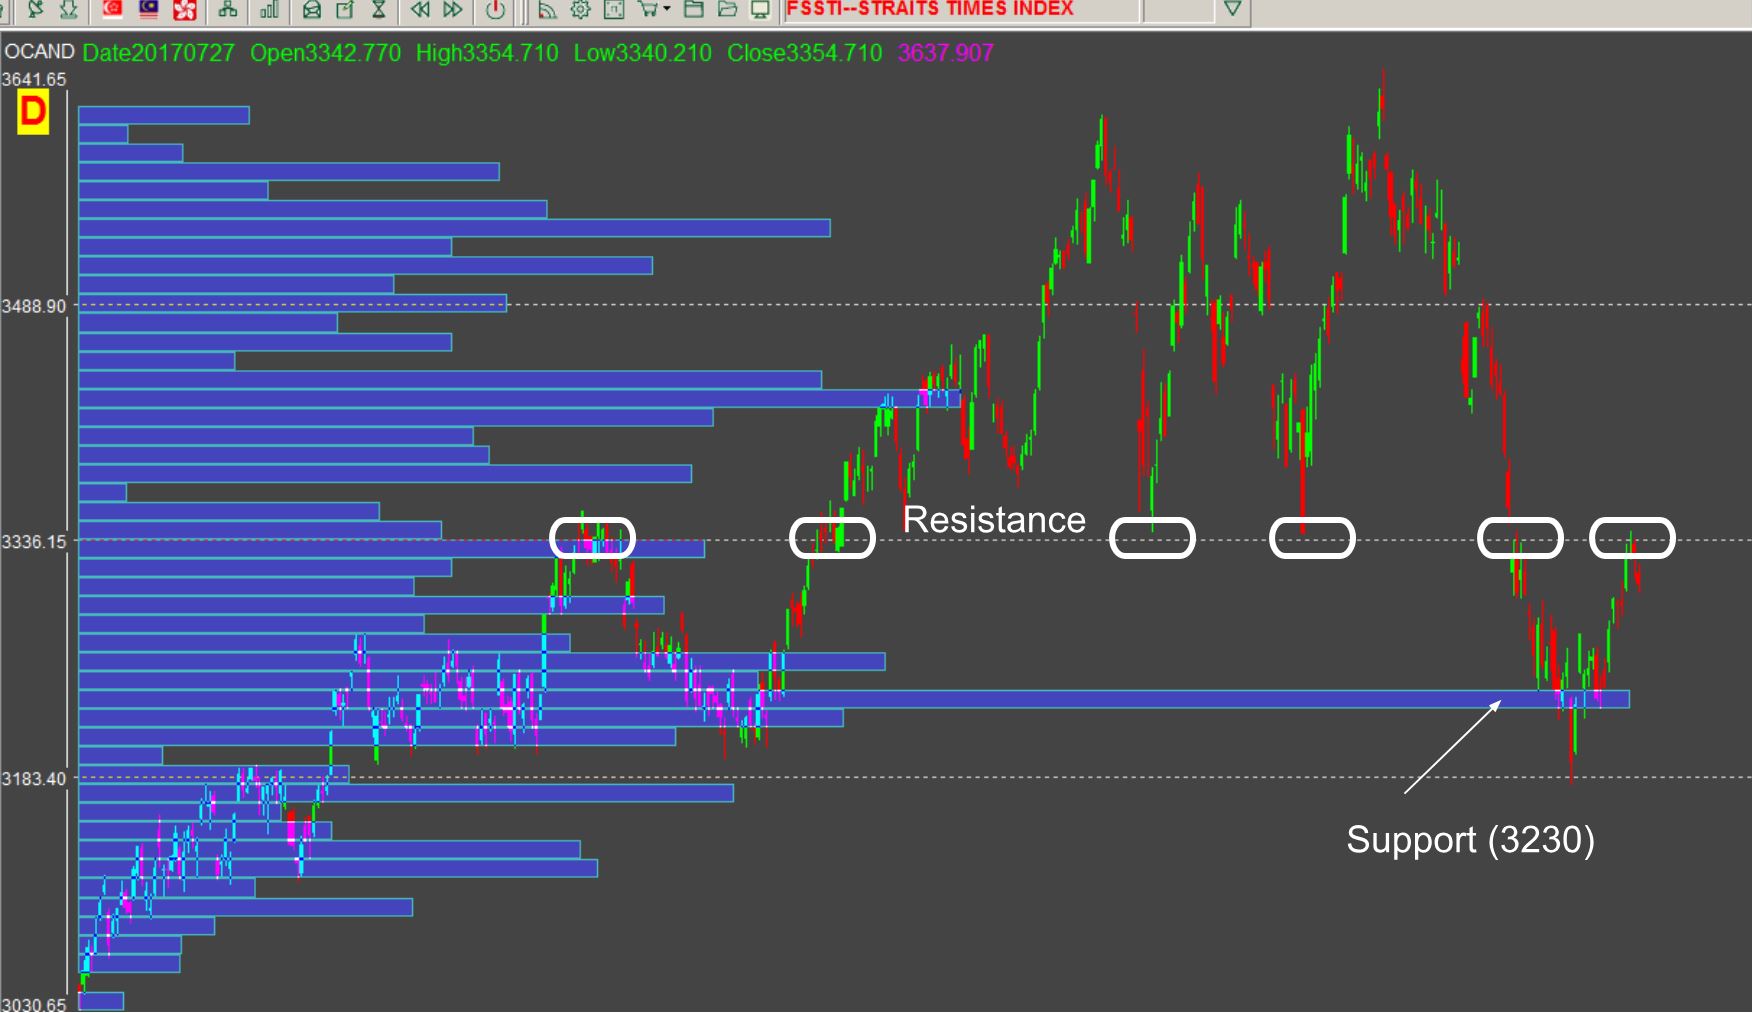
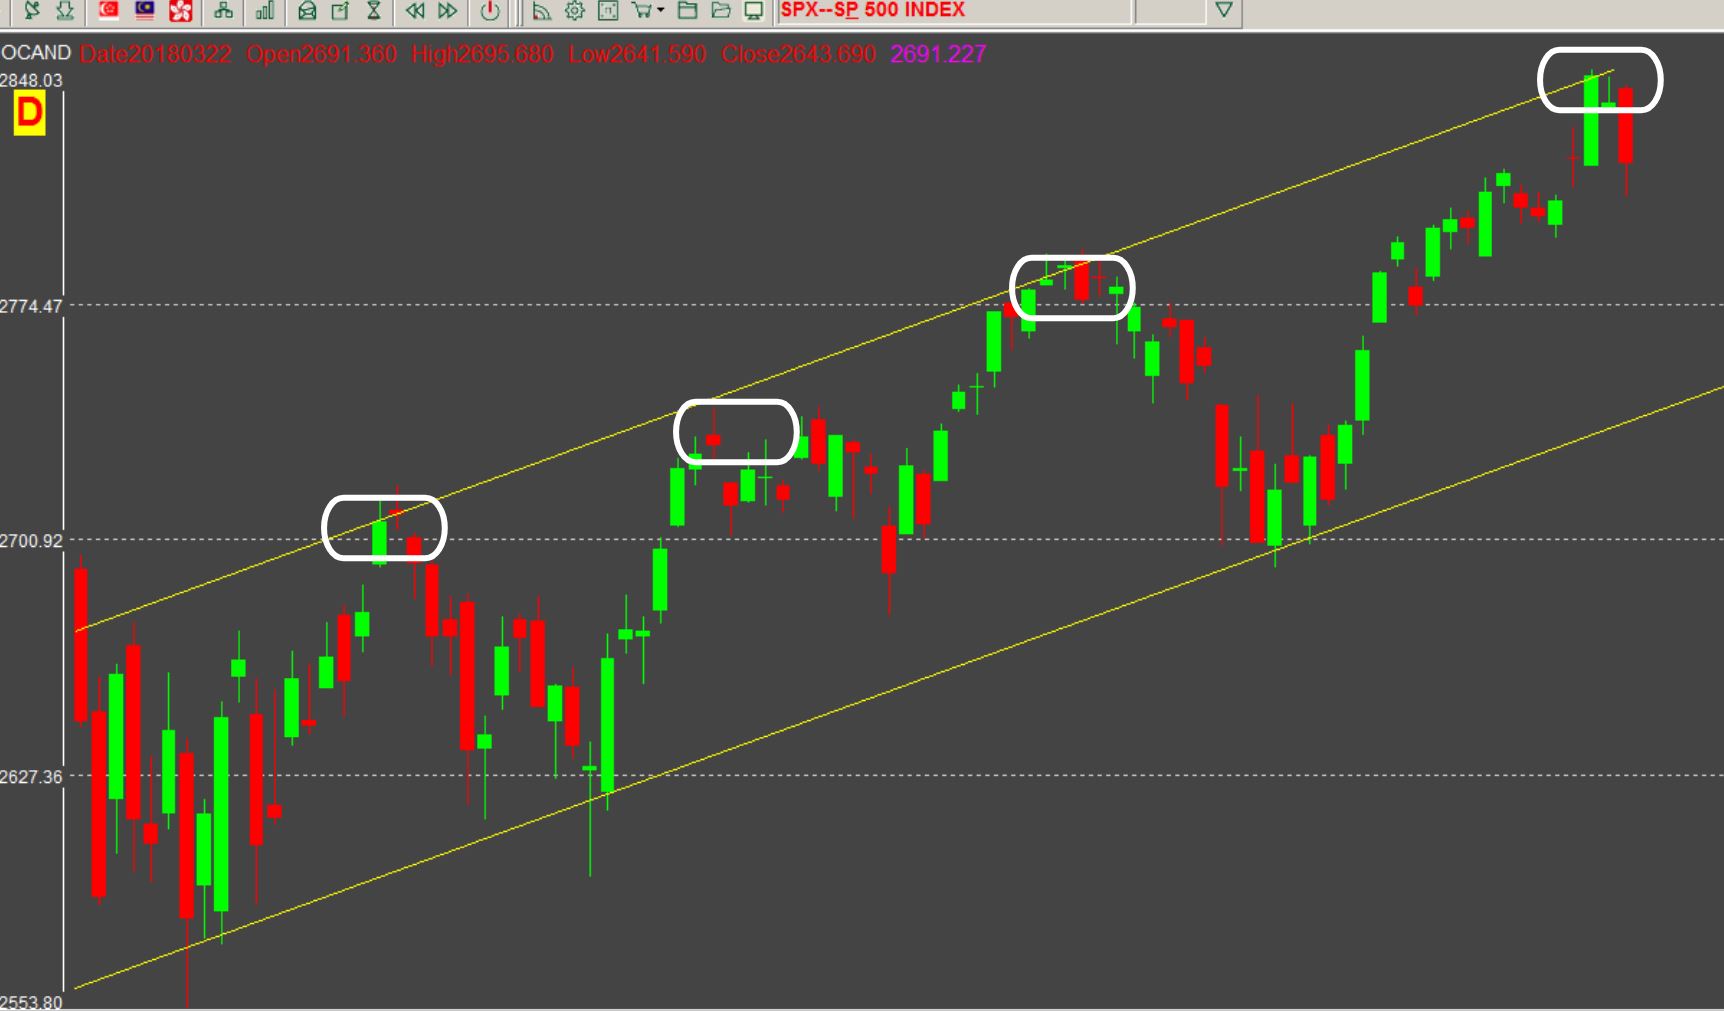
Here are the current daily charts of STI and S&P500 which shows that there are resistance immediately ahead.
STI daily chart :
S&P500 daily chart :
- I'm a remisier with Maybank Securities, and as a bonds and REITs investor myself, I guide my clients to build resilient bonds and REITs portfolios. If you like to be guided, please open a trading account to become my client; It's free!
- WealthLions is my blog where I journal my trading ideas and share my opinions about the markets. If you like to be kept posted of my new blog posts and events, please join my Telegram Channel and subscribe to my mailing list. No spam, I promise.