I wanted to verify from data of the last 20 years, whether our local banks stocks rise when the US Fed Fund Rate rises. I shall use DBS as proxy for our local banks.

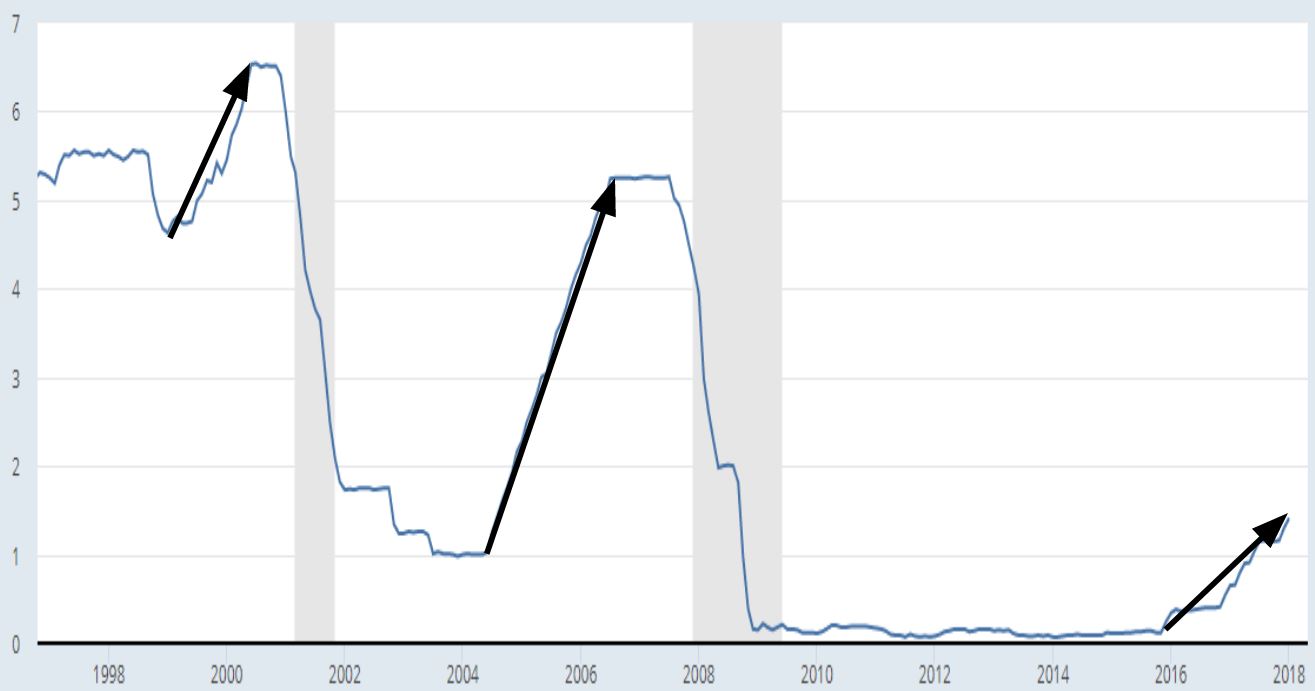
Above is a chart of the US Fed Fund Rate of the last 20 years.
The black arrows are the years which the US Fed Fund Rate rises. The periods are:
- Jan 1999 to July 2000
- June 2004 to Aug 2006
- Dec 2015 to Present
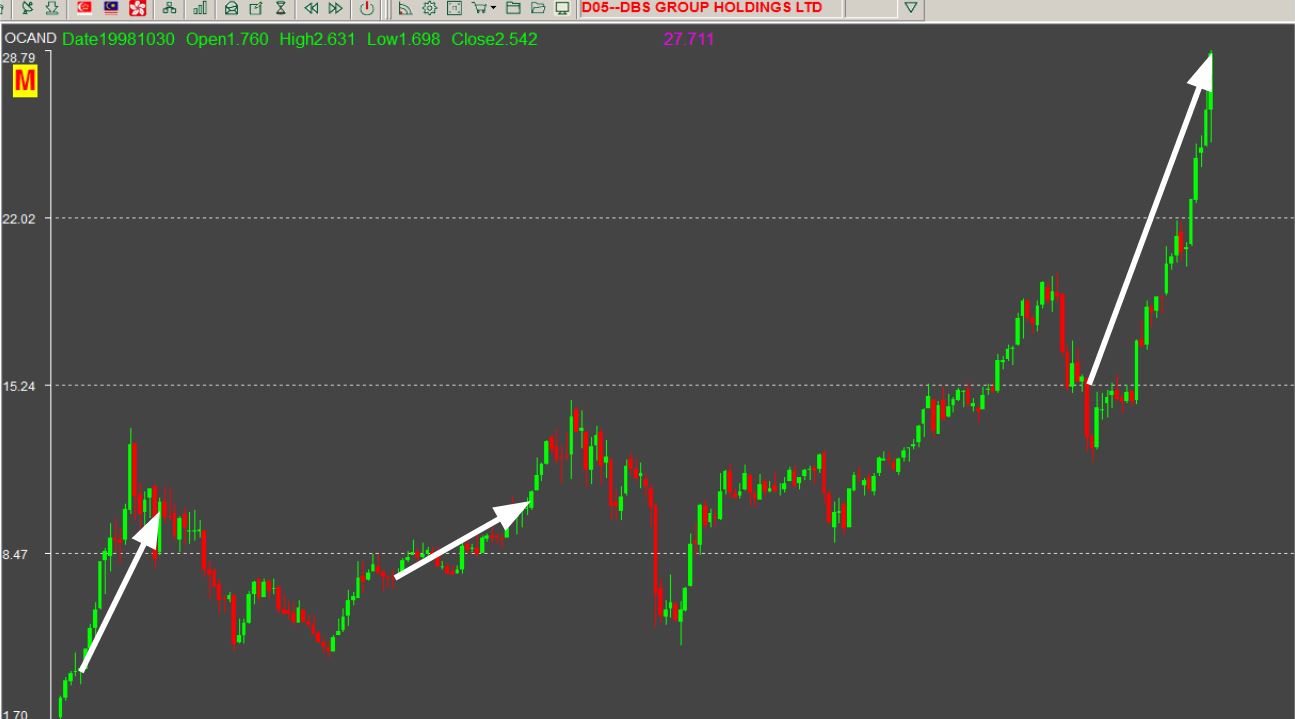
The next chart shows a DBS chart of the last 20 years with the white arrows showing the periods of US Fed Fund Rate increase.

Notice that DBS stock rises when US Fed Fund Rate increases?
The reason is because of net interest margin.
Net interest margin (NIM) is a measure of the difference between the interest income generated by banks and the amount of interest paid out to their lenders, divided by the amount of their interest-earning assets.
Well managed banks should be more profitable when the Fed Fund Rate increases. It is no wonder that our local bank prices have been soaring!
Note:
- I am relying on past data. Future data may not behave in the same way.
- We do not know when the Fed Fund rate will stop rising and come down.
- I'm a remisier with Maybank Securities, and as a bonds and REITs investor myself, I guide my clients to build resilient bonds and REITs portfolios. If you like to be guided, please open a trading account to become my client; It's free!
- WealthLions is my blog where I journal my trading ideas and share my opinions about the markets. If you like to be kept posted of my new blog posts and events, please join my Telegram Channel and subscribe to my mailing list. No spam, I promise.