A common way to value an entity is to use Price / NAV or better known as Price to Book. The traditional way of using Price/NAV is
- above 1 is overvalued
- below 1 is undervalued
Using DBS as an example. DBS’s Price / Nav is 1.35. The first impression is that DBS is overvalued.
But take a look at the 10Y chart of DBS Price/NAV.

Relative to the past 10 years, DBS Price / NAV is at its most undervalued point in the last 10 years!
How can it be? In 2010, DBS share price was about $14. Now its about $26. This chart should be slopping upwards!
Well the reason is very simple. The NAV of DBS has increased tremendously since 2010. When the denominator of a fraction keeps increasing, the fraction keeps getting small.
Based on Price to Book, DBS is at its most undervalued point in its last 10 years!
The similar charts can be derived from UOB (U11/SI) and OCBC (O39.SI).
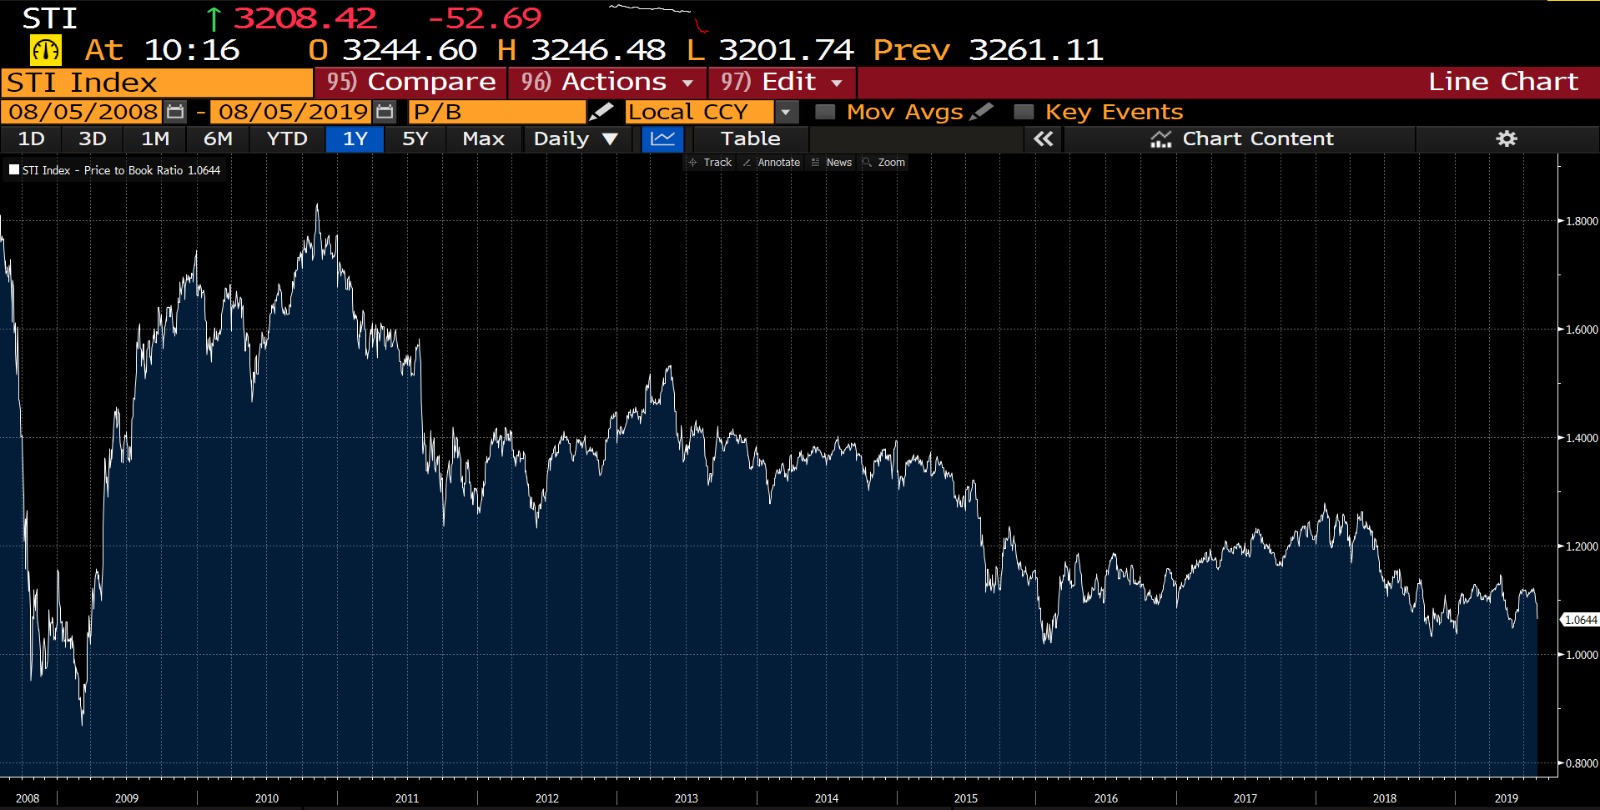
The chart below is the Price / NAV of STI.

The Price to Book value of the STI is at one of its lowest points, just slightly above the Price to Book during the 2008 global financial crisis.
Based on Price to Book valuations, the STI price deserves to be much higher. Similarly, I will be not surprised in the not too distant future, the price of DBS rise to $40.
It was Buffet was said “The money is made in investments by investing and by owning good companies for long periods of time. If you buy good companies and buy them over time, you are going to do fine 10, 20, 30 years from now”.
- I'm a remisier with Maybank Securities, and as a bonds and REITs investor myself, I guide my clients to build resilient bonds and REITs portfolios. If you like to be guided, please open a trading account to become my client; It's free!
- WealthLions is my blog where I journal my trading ideas and share my opinions about the markets. If you like to be kept posted of my new blog posts and events, please join my Telegram Channel and subscribe to my mailing list. No spam, I promise.